Several reports that could be used for making your Material Management efficient and optimize your inventory are:-
ABC Analysis
ABC analysis is an inventory categorization method in which 10-20% materials having 70-80% annual consumption value comes under A while 50% materials that have less than 5% annual consumption value comes under C. B consist 30% materials of the total inventory and their annual consumption value is 15-25%.
The aim of this analysis is to draw managers’ attention on the critical few items (A-items) and the trivial many (C-items).
The inventory can be made more efficient through this analysis by:
- Materials belong to class A should have a tight inventory control i.e. more efforts should be given to providing a secured storage area for these items and sales/production forecast should be done meticulously. Avoiding stock-outs on A-items is a priority. Reorders should be frequent, like weekly.
- Materials belong to class C are at the low demand and overstocking. Reordering of C class items should be made less frequent. Typically, companies only order C-items only when an actual purchase is made. This may lead to stock-outs but it is an acceptable situation as there is a higher risk of excessive inventory costs.
- B- class items should be given an intermediate level of attention. They should also be monitored closely as they have the potential to come to A class and they can also start leaning towards C class items.

| Download |
XYZ Analysis
XYZ Analysis is based on the value of stocks on hand, in some variation of XYZ analysis, it is calculated on the total value of stock received till date. In this analysis inventory of a business is classified into 3 categories where X are items representing 70% of the stock value (Although they may consist only 15-20% quantity) Y are items representing 15-20% of stock value while Z are items representing the remaining value (Although they might consist 65-70% in quantity).
It intends to enable the manager which stock in the inventory requires the focus, time and effort of the management, hence increasing control over the inventory making it lean and efficient. Here’s how inventory is made more efficient by XYZ analysis: –
- X class items are closely monitored and given special attention as they account for a large value and can be small in quantity.
- Y class items are periodically reviewed as they have lower criticality compared to X items
- Z class items require the least attention of the management. These are sometimes issued as “free stock” as they have a high quantity while little value.
Classifying inventory based on XYZ analysis can form the basis of leading plans on alternative stocking arrangements (consignment stock), reorder calculations and can help to determine at what intervals inventory checks are carried out (Like X class items may be required to be checked more frequently than Z class stores).

| Download |

Ageing Analysis
To monitor stock and identify slow-moving inventory, a stock ageing analysis is done. It involves determining the age of material on the basis of its purchase and consumption. Slots of various time periods like 30 to 60 days, 61 to 90 days, 91 to 180 days, and 181 to 360 days, and over 360 days can be prepared to analyze the inventory status of the company at any point of time. Through ageing analysis, you can judge:
- Slow-moving items – the raw materials or finished goods that are getting old can depreciate in value. This will definitely incur a future loss of inventory scrap or high discount for finished products.
- Obsolete inventory – it is possible for the very long aging items to be obsolete and cannot be used either for production or sales purposes. These inventories are to be eliminated at the end.
- Discontinued inventory – a product ending its life cycle by the replacement of a new model or design. This can result in either discontinued raw materials or finished products. Companies need to have a good plan to ensure the smooth phase-out.

| Download |
Average Inventory Report
Average inventory is the mean value of an inventory throughout a certain time period. The average inventory report can be used as a point of comparison when looking at overall sales or production volume. This allows a business to track inventory insights. This will give you various pointers on inventory trends etc, hence you can overcome your inventory’s shortcomings if there are any. It also accounts for various materials in the inventory that could be expired or go bad soon.


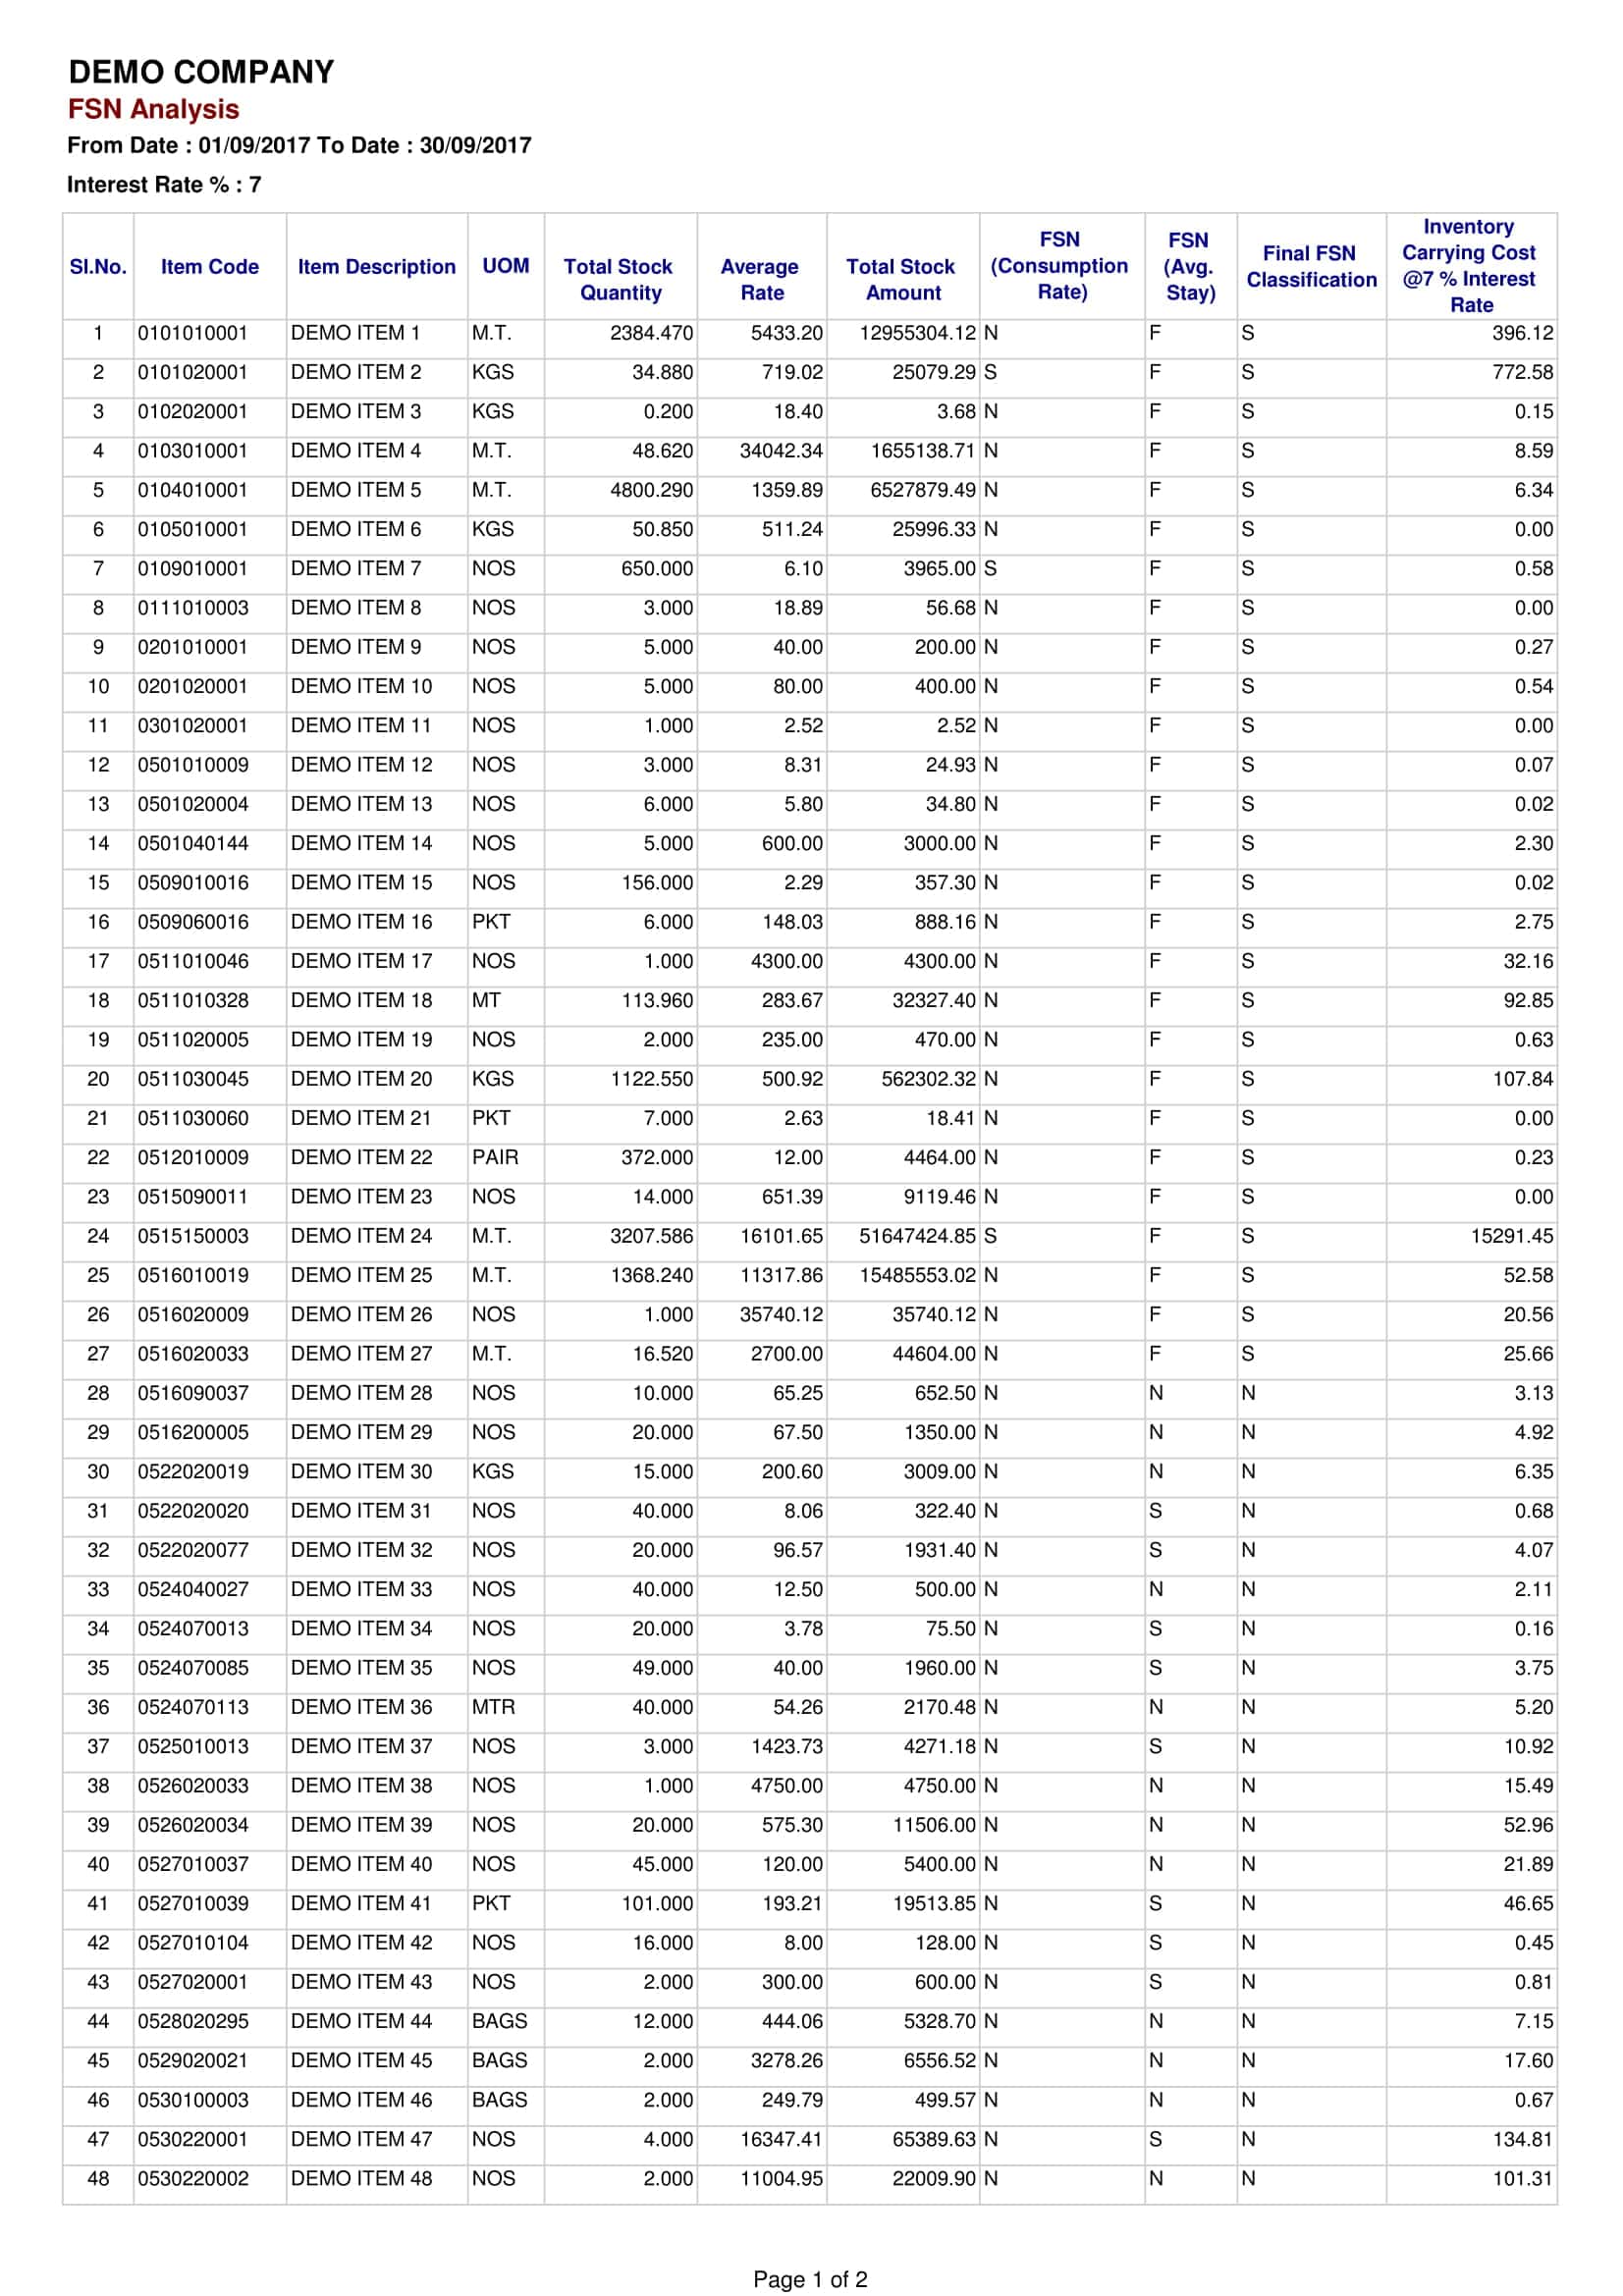
FSN Analysis
In this analysis, items are classified according to their rate of consumption i.e. F is fast moving, S is slow moving, N is non-moving items. This is extremely helpful while distributing items in the inventory. F items should be always kept in disposal as they are being used frequently while S items can be discontinued. This will help in organizing and optimizing the inventory.
| Download |
Comparative Statement
After sending inquiries to multiple vendors about the requirement of materials, you may receive multiple quotations and other details from different vendors. Material Management System provides a mechanism to prepare a comparative statement based on several factors mentioned in quotations from different vendors so that you can choose the right vendor that fulfills your needs.

| Download |
Inventory Turnover
It is the ratio of cost of goods sold by a business during an accounting period to the average inventories of the business during the period. It calculates the time in which a business replenishes its inventory. A very high inventory turnover can mean that business has to replenish their inventory frequently while a low inventory turnover can indicate to overstocking.
For ex :–
Inventory turnover of 300 will mean that inventory has to be replenished in almost every day and inventory turnover of 5 will mean inventory have to replenished almost every 70 days.
Both very high and very low numbers are bad for an organization. Inventory turnover no. should be such that it neither shows overstocking nor any dangers of delaying production.

PO Analysis Value Wise
This is an analysis of the values of PO that are being issued for a certain period of time, If PO is of small values it will mean that PO is being issued as the requirement arises which will be a reflection of poor planning of buying process. Hence value wise PO analysis will tell you about the efficiency of your procurement department.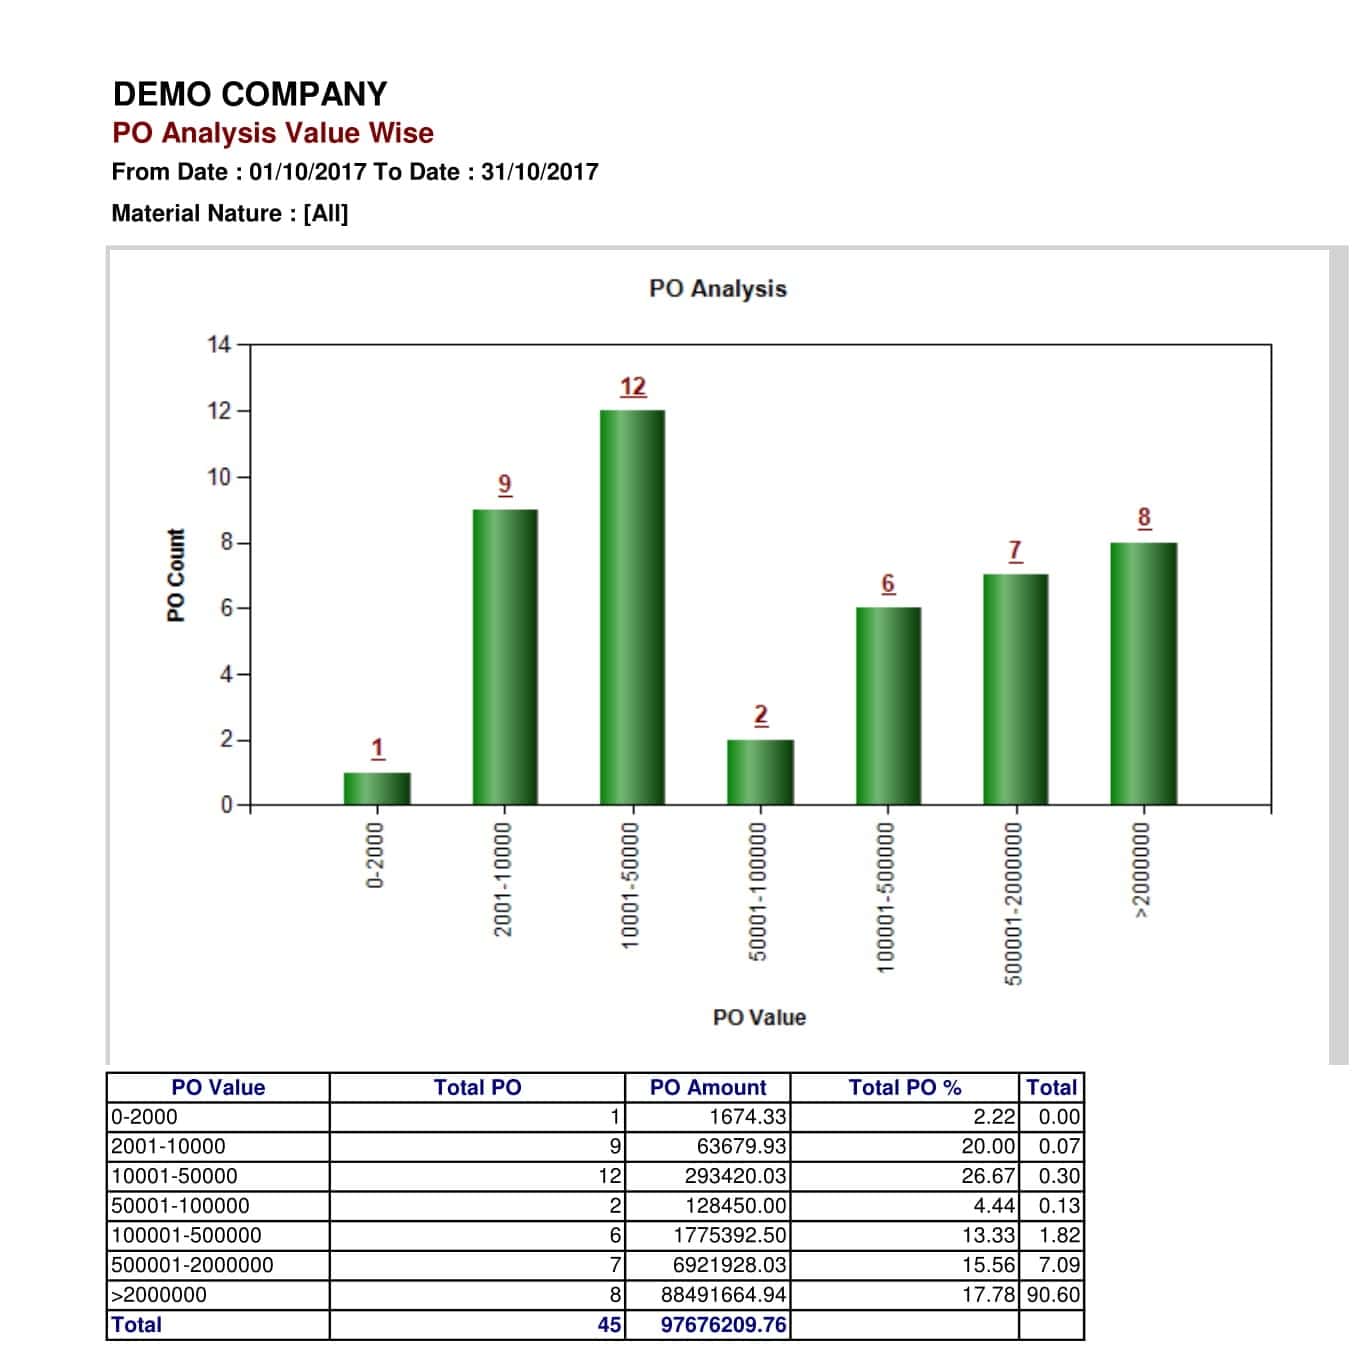
| Download |
There are several other reports that can help in making your material management efficient and your inventory lean. This includes: –
Exception Reporting – You can set a limit for all your reporting areas and you should get reports for any deviation and you’ll know where your intervention is required.
For ex: –
If a particular department or particular equipment’s consumption increases and is now more than the norms, then proper steps towards fixing the equipment or department’s process can be taken to avoid wastage of materials.
Monthly Status Report – There are some KPI’s(Key Performance Indicators) in every company which is used to evaluate the performance of various departments and projects. A monthly status report will provide you an overview of various areas like monthly consumption, average inventory, pending PO’s, pending requirements etc. You can use this data and compare it with your KPI’s to know the performance of your organization and where improvement is needed.
Purchase Spend Analysis – It is the collection, classification, and analysis of expenditure of an industry to decrease procurement cost, improve efficiency and monitor compliance. It also helps in inventory management, budget planning, and product development.
The answers you’ll get from Purchase Spend Analysis are: –
-
- What is the amount you are spending?
- With whom you are spending it?
- Are you getting what you’ve been promised for that spend?
This will give enough visibility to the organization that executives can gain insight into their company purchase, hence helping them in finding new areas of savings that previously went untouched.
Inventory Holding Cost Analysis – Holding costs are the costs associated with storing inventory that remains unsold, and these costs are one component of total inventory costs, along with ordering costs and storage costs. Minimizing holding costs is an important material management strategy that could result in better profitability.
